Integration with Grafana and Prometheus: Real-time monitoring
We are pleased to announce an important addition to BrixWire News Hub: our real-time monitoring system! As a leader in providing cutting-edge solutions for content management and distribution, we understand the importance of staying on top of the health and performance of your operations. That’s why we’ve integrated the Prometheus and Grafana platforms into our ecosystem, giving them the ability to have oversight over their installation.
What are Prometheus and Grafana?
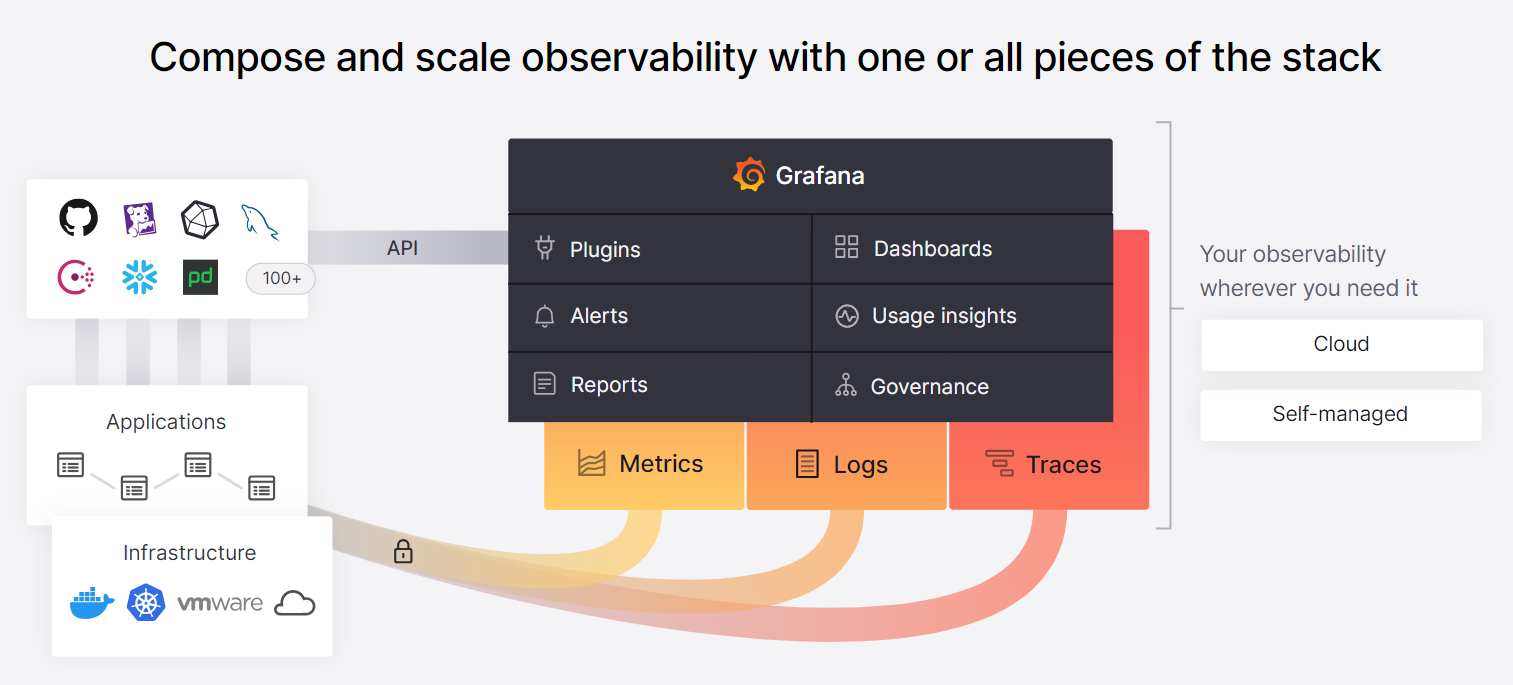
Prometheus and Grafana are the cornerstones of our new monitoring system. Prometheus is an open-source system that collects, stores, and analyzes real-time metrics from your systems and applications. It works by collecting data through various sources, allowing them to understand the performance and status of their operations in great detail.
Grafana, on the other hand, is the ideal tool for visualizing this data. It’s also open-source. It offers interactive and customizable dashboards allowing in-depth analysis of the metrics collected. This gives them a clear, real-time view of how their systems are performing, allowing them to make informed decisions with agility.
How does the monitoring system work?
Prometheus collects the data from the system and Grafana allows the visualization of the same, it is possible to view the data in the form of metrics, logs and histories, among others.
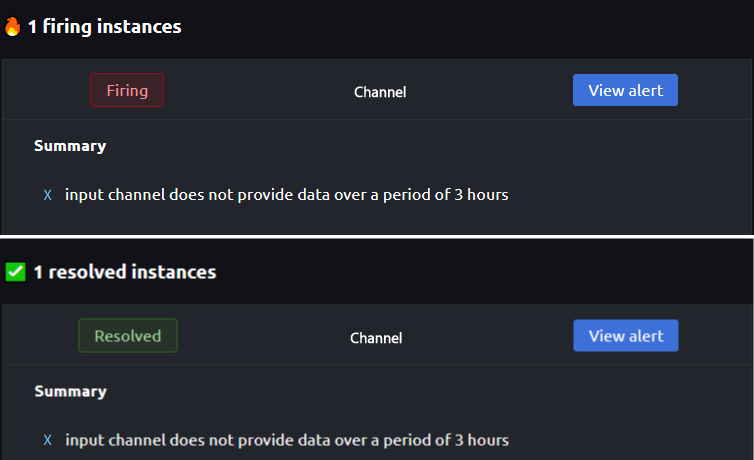
In the same way, the platform has an email alert system, which notifies every time a problem is reported in the system. The notifications are in English, but they are quite easy to understand, in the Summary area the problem is described and there are two types of notifications:
- Firing🔥: Indicates that something is failing, this includes the information of the channel where the problem occurs, it has been defined in this case that every time in a period of 3 hours (this is customizable) in which no content arrives via a certain channel, an alert is issued.
- Resolved✅: Indicates that a previously reported issue has been fixed.
Advantages of a Monitoring System
Implementing Prometheus and Grafana on BrixWire News Hub offers a number of advantages:
- Full Visibility: You will gain a real-time view of the performance of their systems, allowing you to identify and address issues before they become crises.
- Performance Optimization: By identifying bottlenecks and behavior patterns, you can optimize your operations for more efficiency.
- Proactive Alerts: You can set up custom alerts that notify you when certain crucial metrics exceed predefined thresholds, ensuring you are always one step ahead.
Monitoring System Configuration
On the websites of both platforms, it is possible to find all the information and documentation for the configuration of the same, we can gladly provide you with configuration examples for your BrixWire installation in case you need it.